The following graph shows the marginal revenue (MR) , marginal cost (MC) , demand and average revenue (D = AR) curves for a profit-maximizing firm. Refer to the graph to answer the question. 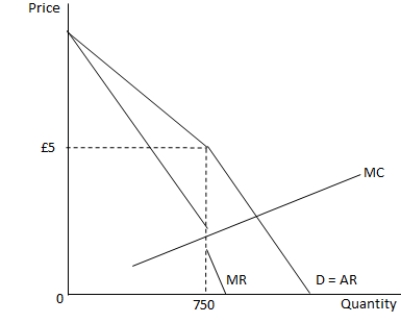 Which of the following statements is true?
A) The demand curve above the market price is relatively inelastic.
B) The demand curve below the market price is relatively elastic.
C) The marginal revenue curve is a vertical line at the profit-maximizing level of output.
D) Marginal cost is greater than marginal revenue at the profit-maximizing level of output.
Correct Answer:
Verified
Q33: A cartel is more likely to be
Q34: A problem often encountered when oligopolists try
Q35: The following table shows the pay-off matrix
Q36: The following graph shows the marginal revenue
Q37: Oligopolists collude in order to_.
A) minimize the
Q39: The following table shows the pay-off matrix
Q40: The kinked demand curve pricing model is
Q41: Which of the following auction formats offers
Q42: Game theory suggests collusion is more likely
Q43: The following graph shows the bid value
Unlock this Answer For Free Now!
View this answer and more for free by performing one of the following actions

Scan the QR code to install the App and get 2 free unlocks

Unlock quizzes for free by uploading documents