In the following graph, QS and QD represent the supply and the demand curves respectively. Refer to the graph to answer the question. 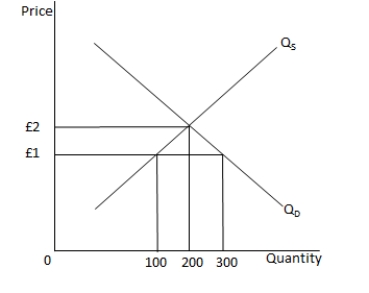
If the maximum price imposed by the government is £1, the total quantity bought and sold in the market will be _____ units.
A) 200
B) 100
C) 0
D) 300
Correct Answer:
Verified
Q42: If the government sets £1 as the
Q43: Data from the UK Society of Motor
Q44: If the government sets £3 as the
Q45: Which of the following is true for
Q46: In the above graph, QS and QD
Q48: The quantity demanded of good X in
Q49: If the price floor for a good
Q50: In the following graph, QS and QD
Q51: Which of the following is true for
Q52: Which of the following is a feature
Unlock this Answer For Free Now!
View this answer and more for free by performing one of the following actions

Scan the QR code to install the App and get 2 free unlocks

Unlock quizzes for free by uploading documents