In the following graph, QS1 and QS2 are the supply curves for labour and QD1 is the demand curve for labour. Refer to the graph to answer the question. 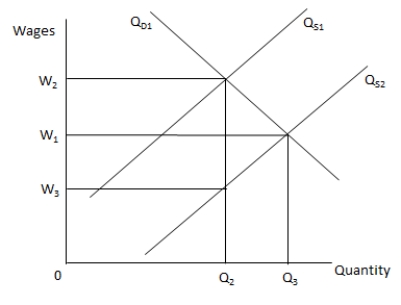
When QS1 shifts to QS2, _____.
A) the equilibrium quantity and wage level remain unchanged
B) the equilibrium quantity of labour increases
C) the wage level rises to W3
D) the demand for labour exceeds the supply of labour
Correct Answer:
Verified
Q54: If it is difficult to differentiate between
Q55: Suppose firms are able to hire labour
Q56: Which of the following provides a solution
Q57: In the following graph, QS1 and QS2
Q58: Which of the following is likely to
Q60: If the price of grapes is below
Q61: If the equilibrium price of a product
Q62: Given that shoes and shoe polish are
Q63: An increase in the supply of oranges
Q64: A firm that is operating with excess
Unlock this Answer For Free Now!
View this answer and more for free by performing one of the following actions

Scan the QR code to install the App and get 2 free unlocks

Unlock quizzes for free by uploading documents