In the following graph, QS1 and QS2 are the supply curves for labour and QD1 and QD2 are the demand curves for labour. Refer to the graph to answer the question. 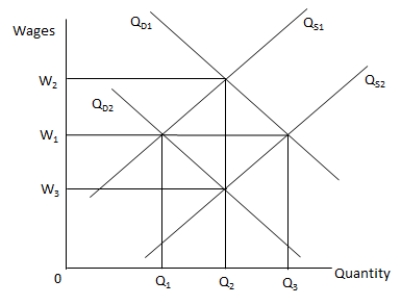 When QS1 shifts to QS2 and QD1 shifts to QD2, _____.
A) the supply of labour exceeds the demand for labour
B) the demand for labour exceeds the supply of labour
C) the quantity of labour demanded falls
D) the equilibrium quantity of labour remains constant
Correct Answer:
Verified
Q52: Which of the following is a feature
Q53: In the following graph, QS1 is the
Q54: If it is difficult to differentiate between
Q55: Suppose firms are able to hire labour
Q56: Which of the following provides a solution
Q58: Which of the following is likely to
Q59: In the following graph, QS1 and QS2
Q60: If the price of grapes is below
Q61: If the equilibrium price of a product
Q62: Given that shoes and shoe polish are
Unlock this Answer For Free Now!
View this answer and more for free by performing one of the following actions

Scan the QR code to install the App and get 2 free unlocks

Unlock quizzes for free by uploading documents