In the following graph, QS1 is the supply curve for labour and QD1 and QD2 are the demand curves for labour. Refer to the graph to answer the question. 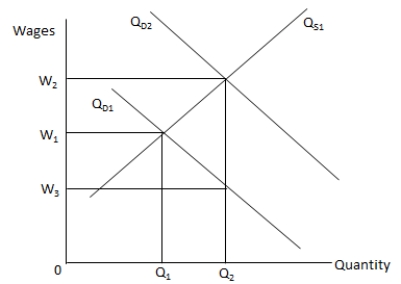
When QD1 shifts to QD2, _____.
A) the equilibrium quantity of labour and the wage level remain unchanged
B) the quantity of labour supplied increases
C) the wage level falls to W3
D) the supply of labour exceeds the demand for labour
Correct Answer:
Verified
Q48: The quantity demanded of good X in
Q49: If the price floor for a good
Q50: In the following graph, QS and QD
Q51: Which of the following is true for
Q52: Which of the following is a feature
Q54: If it is difficult to differentiate between
Q55: Suppose firms are able to hire labour
Q56: Which of the following provides a solution
Q57: In the following graph, QS1 and QS2
Q58: Which of the following is likely to
Unlock this Answer For Free Now!
View this answer and more for free by performing one of the following actions

Scan the QR code to install the App and get 2 free unlocks

Unlock quizzes for free by uploading documents