This graphic representation of the data from an exercise and health study shows the association between energy level and compliance with a yoga routine. The relationship depicted isonly moderate but shows that the more people complied with the yoga routine the more energy they felt they had, which indicates a _____. 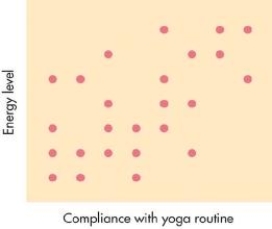
A) negative correlation
B) correlation that is close to zero
C) positive correlation
D) correlation coefficient of 1.00 or higher
Correct Answer:
Verified
Q7: This graphic representation of the data from
Q8: Yoshiko decided to organize the data from
Q9: This graphic representation of the data from
Q10: A _ is like a bar chart
Q11: In a graph displaying family income in
Q13: Data from the health promotion study described
Q14: The type of statistics used to organize,
Q15: A _ distribution is a symmetrical, meaning
Q16: This graphic representation of the data from
Q17: This table shows the number of people
Unlock this Answer For Free Now!
View this answer and more for free by performing one of the following actions

Scan the QR code to install the App and get 2 free unlocks

Unlock quizzes for free by uploading documents