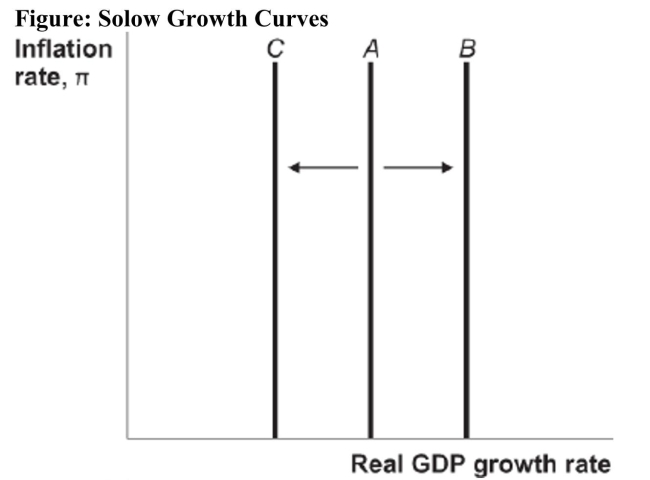
 Reference: Ref 13-2 (Figure: Solow Growth Curves) Which of the following choices can explain the shift of the Solow growth curve from A to B in the figure?
A) development of new technology
B) war
C) negative supply shock
D) oil crisis
Correct Answer:
Verified
Q25: Suppose both the growth rate of the
Q27: The Solow growth rate occurs when I.
Q28: In a diagram with the inflation rate
Q29: Figure: Solow Growth Curves Reference: Ref 13-2
Q31: The Solow growth curve is represented by
Q32: The dynamic aggregate demand curve is
A) upward
Q33: An increase in spending growth will cause
Q34: The Solow growth curve is
A) upward sloping.
B)
Q64: A major hurricane hitting the East Coast
Q71: The "Solow" growth rate is the rate
Unlock this Answer For Free Now!
View this answer and more for free by performing one of the following actions

Scan the QR code to install the App and get 2 free unlocks

Unlock quizzes for free by uploading documents