Multiple Choice
Figure: Solow Growth Curves Reference: Ref 13-2 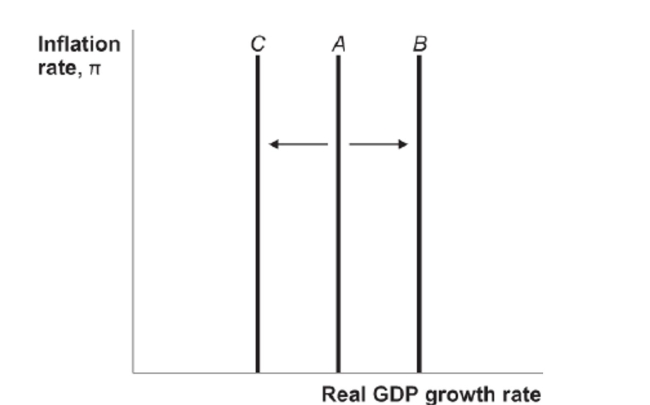 (Figure: Solow Growth Curves) Which of the following answer choices can explain the shift of the Solow growth curve from A to C in the figure?
A) development of new technology
B) an increase in the nation's factors of production
C) negative supply shock
D) increase in oil supply
Correct Answer:
Verified
Related Questions
Q24: A real shock causes
A) a shift of
Q25: Suppose both the growth rate of the
Q27: The Solow growth rate occurs when I.
Q28: In a diagram with the inflation rate
Unlock this Answer For Free Now!
View this answer and more for free by performing one of the following actions

Scan the QR code to install the App and get 2 free unlocks

Unlock quizzes for free by uploading documents