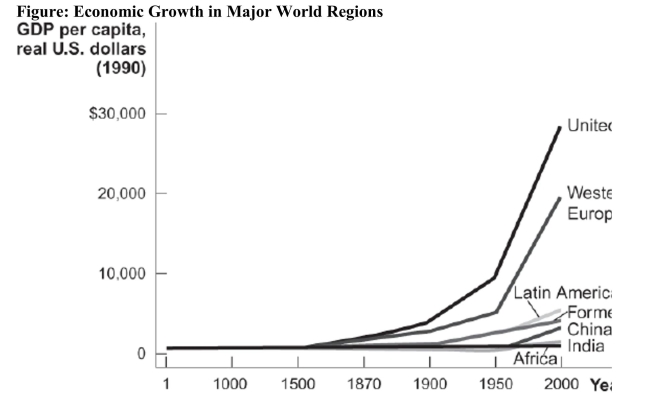
 Reference: Ref 7-2 (Figure: Economic Growth in Major World Regions) Refer to the figure, which shows us how real GDP per capita has been changing over time in different regions of the world. Studying the chart shows
A) that all these regions and countries were poor at one time.
B) the distribution of wealth within the various regions over time.
C) the rate of infant mortality within the various regions over time.
D) the level of life expectancy within the various regions at various points in time.
Correct Answer:
Verified
Q3: If 10 percent of the population had
Q4: Suppose a country has real GDP of
Q5: What percentage of the world's population lives
Q6: The United States and Western European countries
Q7: In the year 2000, the world's average
Unlock this Answer For Free Now!
View this answer and more for free by performing one of the following actions

Scan the QR code to install the App and get 2 free unlocks

Unlock quizzes for free by uploading documents