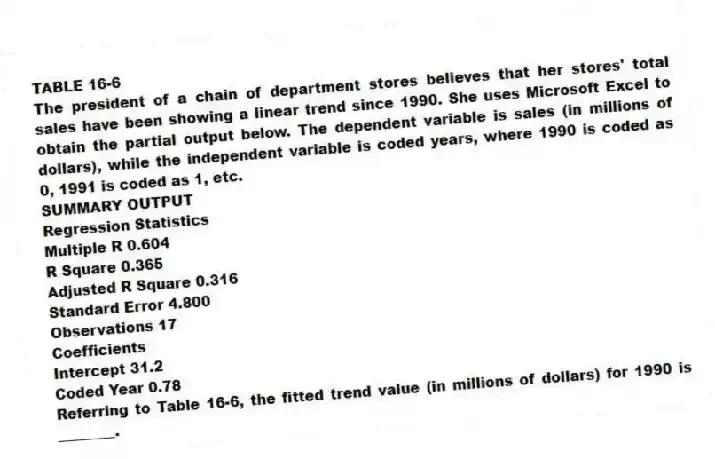
TABLE 16-6
The president of a chain of department stores believes that her stores' total sales have been showing a linear trend since 1990. She uses Microsoft Excel to obtain the partial output below. The dependent variable is sales (in millions of dollars), while the independent variable is coded years, where 1990 is coded as 0, 1991 is coded as 1, etc.
SUMMARY OUTPUT
Regression Statistics
Multiple R 0.604
R Square 0.365
Adjusted R Square 0.316
Standard Error 4.800
Observations 17
Coefficients
Intercept 31.2
Coded Year 0.78
-Referring to Table 16-6, the fitted trend value (in millions of dollars) for 1990 is ________.
Correct Answer:
Verified
Q84: TABLE 16-6
The president of a chain of
Q85: TABLE 16-8
The manager of a marketing consulting
Q86: TABLE 16-8
The manager of a marketing consulting
Q87: TABLE 16-9
Given below are Excel outputs for
Q88: TABLE 16-7
The executive vice-president of a drug
Q90: TABLE 16-5
The number of passengers arriving at
Q91: TABLE 16-6
The president of a chain of
Q92: TABLE 16-7
The executive vice-president of a drug
Q93: TABLE 16-8
The manager of a marketing consulting
Q94: TABLE 16-5
The number of passengers arriving at
Unlock this Answer For Free Now!
View this answer and more for free by performing one of the following actions

Scan the QR code to install the App and get 2 free unlocks

Unlock quizzes for free by uploading documents