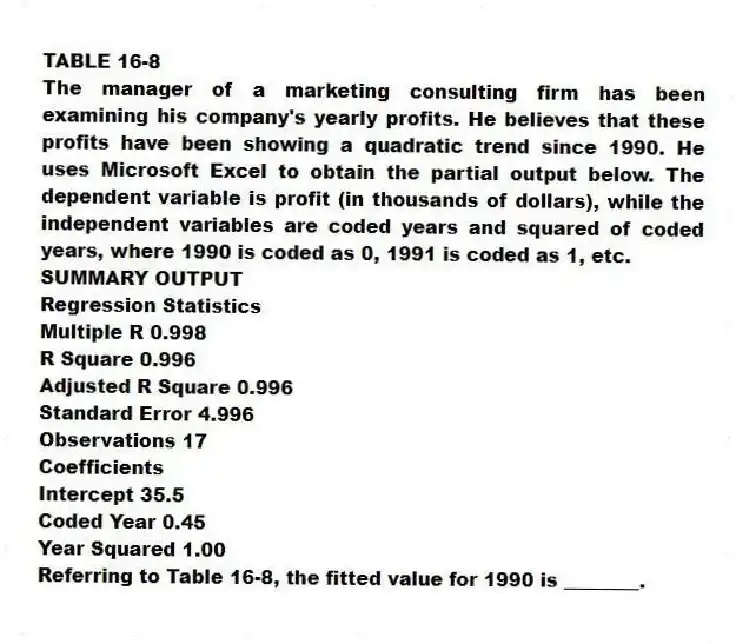
TABLE 16-8
The manager of a marketing consulting firm has been examining his company's yearly profits. He believes that these profits have been showing a quadratic trend since 1990. He uses Microsoft Excel to obtain the partial output below. The dependent variable is profit (in thousands of dollars), while the independent variables are coded years and squared of coded years, where 1990 is coded as 0, 1991 is coded as 1, etc.
SUMMARY OUTPUT
Regression Statistics
Multiple R 0.998
R Square 0.996
Adjusted R Square 0.996
Standard Error 4.996
Observations 17
Coefficients
Intercept 35.5
Coded Year 0.45
Year Squared 1.00
-Referring to Table 16-8, the fitted value for 1990 is ________.
Correct Answer:
Verified
Q80: TABLE 16-5
The number of passengers arriving at
Q81: TABLE 16-8
The manager of a marketing consulting
Q82: TABLE 16-10
Business closures in Laramie, Wyoming from
Q83: TABLE 16-6
The president of a chain of
Q84: TABLE 16-6
The president of a chain of
Q86: TABLE 16-8
The manager of a marketing consulting
Q87: TABLE 16-9
Given below are Excel outputs for
Q88: TABLE 16-7
The executive vice-president of a drug
Q89: TABLE 16-6
The president of a chain of
Q90: TABLE 16-5
The number of passengers arriving at
Unlock this Answer For Free Now!
View this answer and more for free by performing one of the following actions

Scan the QR code to install the App and get 2 free unlocks

Unlock quizzes for free by uploading documents