(Figure: Determining Surplus) In the graph, which shape represents producer surplus? 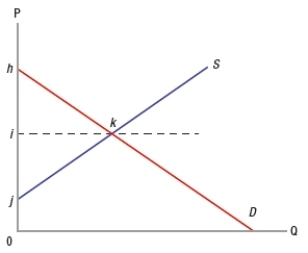
A) triangle hik
B) line ij
C) line hi
D) triangle ijk
Correct Answer:
Verified
Q43: Assume dairy farmers saw high profits the
Q44: Synthetic clothing releases fibers during the washing
Q45: (Figure: Understanding Surplus and Efficiency) In the
Q46: (Figure: Determining Surplus and Loss) Consider the
Q47: (Figure: Determining Surplus and Loss) Consider the
Q49: (Figure: Determining Total Surplus) In the graph,
Q50: Suppose the market price is $5. The
Q51: The United States has an aging population,
Q52: The price of green grapes increases from
Q53: A legal maximum price that can be
Unlock this Answer For Free Now!
View this answer and more for free by performing one of the following actions

Scan the QR code to install the App and get 2 free unlocks

Unlock quizzes for free by uploading documents