(Figure: Understanding Surplus and Efficiency) In the graph, what is producer surplus when the market price is $10? 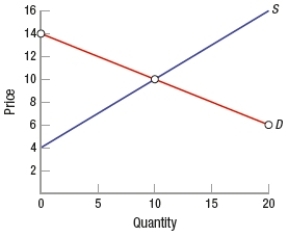
A) $30
B) $40
C) $60
D) $20
Correct Answer:
Verified
Q40: In 2016, some counties in Florida sprayed
Q41: (Figure: Determining Total Surplus) In the graph,
Q42: (Figure: Determining Surplus 3) In the graph,
Q43: Assume dairy farmers saw high profits the
Q44: Synthetic clothing releases fibers during the washing
Q46: (Figure: Determining Surplus and Loss) Consider the
Q47: (Figure: Determining Surplus and Loss) Consider the
Q48: (Figure: Determining Surplus) In the graph, which
Q49: (Figure: Determining Total Surplus) In the graph,
Q50: Suppose the market price is $5. The
Unlock this Answer For Free Now!
View this answer and more for free by performing one of the following actions

Scan the QR code to install the App and get 2 free unlocks

Unlock quizzes for free by uploading documents