(Figure: Understanding Surplus and Efficiency) In the graph, what is the efficient level of output? 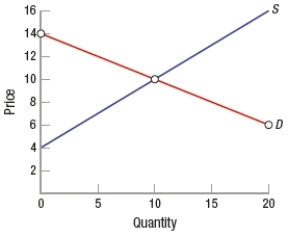
A) 0
B) 5
C) 10
D) 14
Correct Answer:
Verified
Q88: If one person consumes a public good
A)
Q89: (Figure: Determining Surplus) In the graph, the
Q90: Consumer surplus minus producer surplus equals deadweight
Q91: The gap between the supply curve and
Q92: (Figure: Understanding Surplus and Efficiency) In the
Q94: (Figure: Interpreting Surplus) In the supply/demand graph
Q95: (Figure: Determining Surplus and Loss) In the
Q96: A price ceiling is a _ which
Q97: Asymmetric information reduces deadweight loss.
Q98: Which activity does NOT typically generate an
Unlock this Answer For Free Now!
View this answer and more for free by performing one of the following actions

Scan the QR code to install the App and get 2 free unlocks

Unlock quizzes for free by uploading documents