(Figure: Interpreting Surplus) In the supply/demand graph 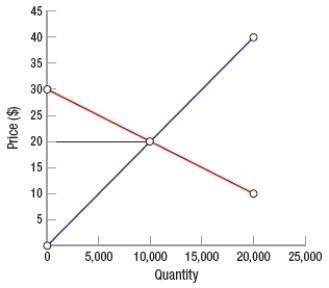
A) consumer surplus is $50,000 and producer surplus is $100,000.
B) total market surplus is $200,000.
C) total market surplus is $50,000.
D) consumer surplus is larger than producer surplus.
Correct Answer:
Verified
Q89: (Figure: Determining Surplus) In the graph, the
Q90: Consumer surplus minus producer surplus equals deadweight
Q91: The gap between the supply curve and
Q92: (Figure: Understanding Surplus and Efficiency) In the
Q93: (Figure: Understanding Surplus and Efficiency) In the
Q95: (Figure: Determining Surplus and Loss) In the
Q96: A price ceiling is a _ which
Q97: Asymmetric information reduces deadweight loss.
Q98: Which activity does NOT typically generate an
Q99: Minimum wage laws
A) create a price floor
Unlock this Answer For Free Now!
View this answer and more for free by performing one of the following actions

Scan the QR code to install the App and get 2 free unlocks

Unlock quizzes for free by uploading documents