Multiple Choice
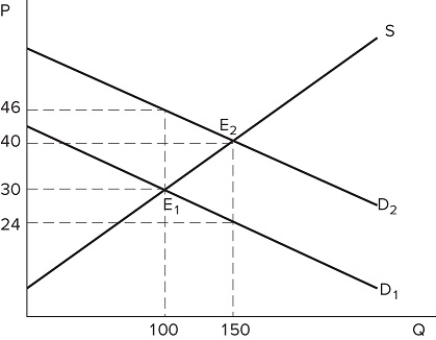 The graph shown portrays a subsidy to buyers. The subsidy causes _______ units to be sold in this market.
A) 50 more
B) 150 more
C) 100 fewer
D) 50 fewer
Correct Answer:
Verified
Related Questions
The graph shown portrays a subsidy to buyers. The subsidy causes _______ units to be sold in this market.
A) 50 more
B) 150 more
C) 100 fewer
D) 50 fewer
Correct Answer:
Verified

