Multiple Choice
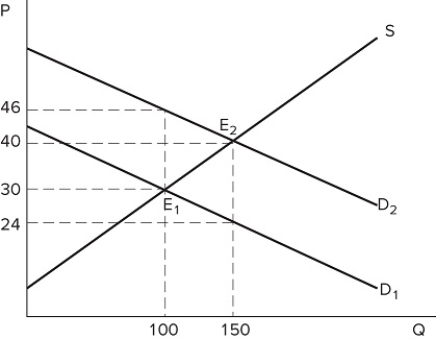 The graph shown portrays a subsidy to buyers. With the subsidy, buyers will purchase _______ units, and the post-subsidy price paid for each one is _______.
A) 100; $46
B) 100; $30
C) 150; $40
D) 150; $24
Correct Answer:
Verified
Related Questions
Q151: A subsidy:
A) has the exact same impact

