Multiple Choice
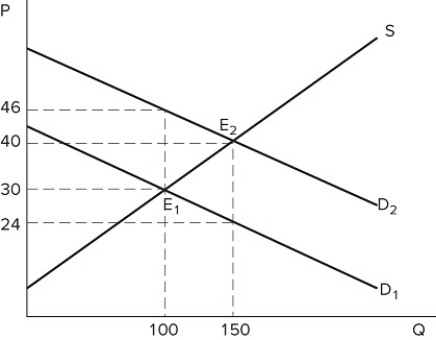 The graph shown portrays a subsidy to buyers. What is the amount of the subsidy per unit of this good?
A) $22
B) $16
C) $10
D) $6
Correct Answer:
Verified
Related Questions
The graph shown portrays a subsidy to buyers. What is the amount of the subsidy per unit of this good?
A) $22
B) $16
C) $10
D) $6
Correct Answer:
Verified

