Multiple Choice
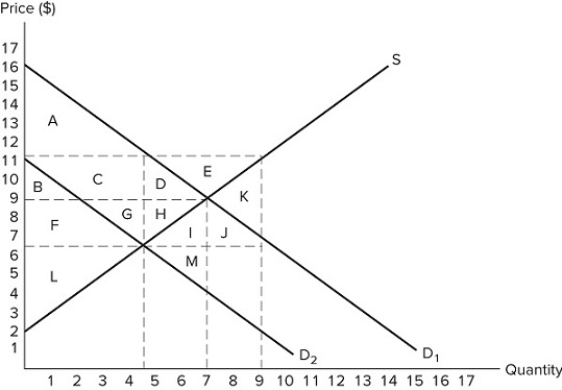 The graph shown portrays a subsidy to buyers. What area(s) represent the deadweight loss that arises from this subsidy?
A) D + H
B) K
C) E
D) I + M
Correct Answer:
Verified
Related Questions
The graph shown portrays a subsidy to buyers. What area(s) represent the deadweight loss that arises from this subsidy?
A) D + H
B) K
C) E
D) I + M
Correct Answer:
Verified

