Multiple Choice
 The graph shown portrays a subsidy to buyers. What will result from this subsidy?
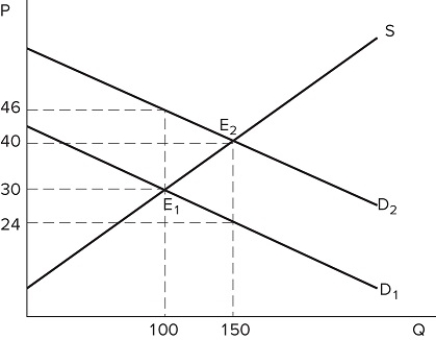
A) A higher quantity will be bought a nd sold at a higher price.
B) Customers will be worse off than before the subsidy was placed.
C) Producers will be worse off than before the subsidy was placed.
D) None of these are true.
Correct Answer:
Verified
Related Questions

