Multiple Choice
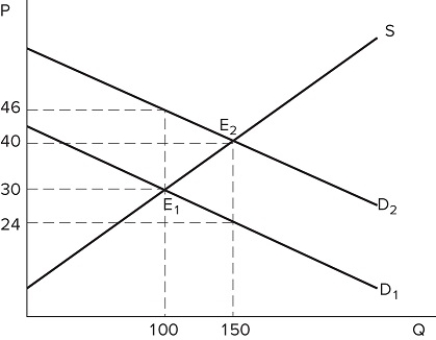 The graph shown portrays a subsidy to buyers. After the subsidy is in place, the post-subsidy price paid by buyers is _______ and the post-subsidy price received by sellers is _______; the difference between these two figures is the amount of _______.
A) $24; $40; the subsidy
B) $30; $46; the subsidy
C) $40; $24; the subsidy
D) $24; $40; government revenue
Correct Answer:
Verified
Related Questions

