Multiple Choice
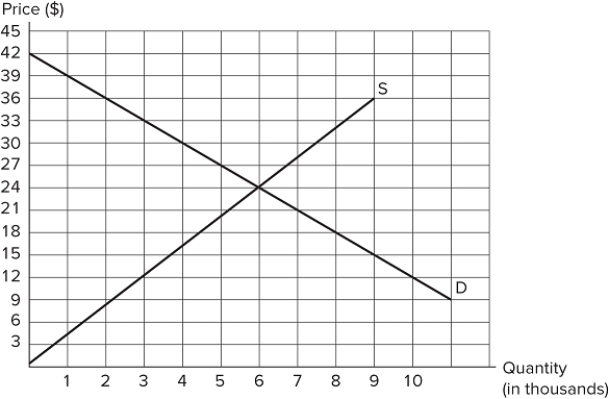 The graph shown depicts the market for a good. At a price of $12, there is:
A) a surplus (excess supply) of 10,000 units.
B) a shortage (excess demand) of 10,000 units.
C) a shortage (excess demand) of 7,000 units.
D) a surplus (excess supply) of 3,000 units.
Correct Answer:
Verified
Related Questions
Q150: Q151: Q152: Consider a market that is in equilibrium. Q153: Suppose the price of oil has recently Q154: Suppose the price of oil has recently Q156: Consider a market that is in equilibrium. Unlock this Answer For Free Now! View this answer and more for free by performing one of the following actions Scan the QR code to install the App and get 2 free unlocks Unlock quizzes for free by uploading documents![]()
![]()

