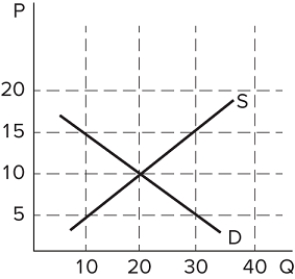
 The graph shown depicts the market for a good. At a price of $15, there is:
A) a shortage (excess demand) of 10 units.
B) a shortage (excess demand) of 20 units.
C) a shortage (excess demand) of 30 units.
D) a surplus (excess supply) of 20 units.
Correct Answer:
Verified
Q152: Consider a market that is in equilibrium.
Q153: Suppose the price of oil has recently
Q154: Suppose the price of oil has recently
Q155: Q156: Consider a market that is in equilibrium. Q158: Suppose a tornado levels hundreds of homes. Q159: Consider a market that is in equilibrium. Q160: Suppose the price of gasoline has recently Q161: Consider the market for pecans, which is Q162: ![]()
![]()
Unlock this Answer For Free Now!
View this answer and more for free by performing one of the following actions

Scan the QR code to install the App and get 2 free unlocks

Unlock quizzes for free by uploading documents