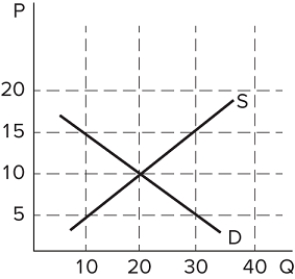
 The graph shown depicts the market for a good. What state is this market in if the price of the good is $5?
A) There is a shortage (excess demand) , signaling that sellers should leave the market.
B) There is a shortage (excess demand) , signaling that buyers should bid up the price.
C) There is a surplus (excess supply) , signaling that sellers should drop their price.
D) There is a surplus (excess supply) , signaling that buyers should bid up the price.
Correct Answer:
Verified
Q137: The equilibrium price is sometimes called the:
A)
Q138: If a producer incorrectly sets the price
Q139: When does a surplus occur?
A) When the
Unlock this Answer For Free Now!
View this answer and more for free by performing one of the following actions

Scan the QR code to install the App and get 2 free unlocks

Unlock quizzes for free by uploading documents