Multiple Choice
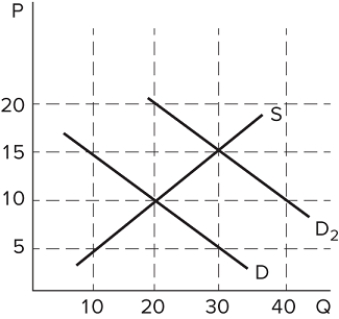 The graph shown depicts the market for a good. Assume the market was originally in equilibrium where the demand curve (D) and supply curve (S) intersect. What was the original equilibrium price and quantity for this good?
A) $5 and 30
B) $5 and 20
C) $10 and 20
D) $20 and 10
Correct Answer:
Verified
Related Questions
Q136: Q137: The equilibrium price is sometimes called the: Q138: If a producer incorrectly sets the price Q139: When does a surplus occur? Unlock this Answer For Free Now! View this answer and more for free by performing one of the following actions Scan the QR code to install the App and get 2 free unlocks Unlock quizzes for free by uploading documents![]()
A)
A) When the

