The graph shown displays various price and output levels in an economy. 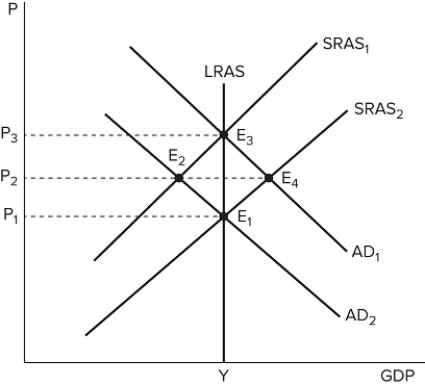 Which point on the graph shown would represent an economic expansion?
A) E 1
B) E 2
C) E 3
D) E 4
Correct Answer:
Verified
Q33: Price indexes allow us to convert _
Q34: The classical theory of inflation illustrates the
Q35: The actual quantity of goods or services
Q36: The graph shown displays various price and
Q37: The graph shown displays various price and
Q39: Price indexes:
A) allow us to convert nominal
Q40: If the Fed doubled the money supply
Q41: If an economy produces 3,000 units of
Q42: The graph shown displays various price and
Q43: If an economy produces 1,000 units of
Unlock this Answer For Free Now!
View this answer and more for free by performing one of the following actions

Scan the QR code to install the App and get 2 free unlocks

Unlock quizzes for free by uploading documents