The graph shown displays various price and output levels in an economy. 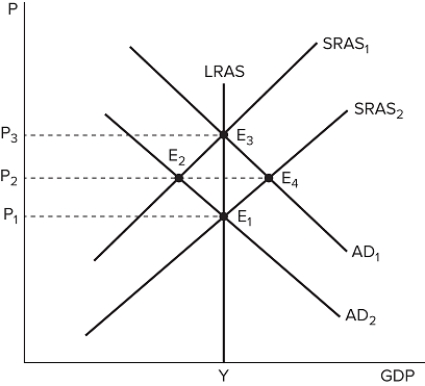 If the economy is currently at point E2, the Fed is most likely to undertake _______ monetary policy because it will shift _______.
A) expansionary; AD to the right
B) contractionary; AD to the left
C) expansionary; AD to the left
D) contractionary; AS to the right
Correct Answer:
Verified
Q37: The graph shown displays various price and
Q38: The graph shown displays various price and
Q39: Price indexes:
A) allow us to convert nominal
Q40: If the Fed doubled the money supply
Q41: If an economy produces 3,000 units of
Q43: If an economy produces 1,000 units of
Q44: The quantity theory of money relies on
Q45: According to the quantity theory of money,
Q46: The graph shown displays various price and
Q47: According to the quantity theory of money,
Unlock this Answer For Free Now!
View this answer and more for free by performing one of the following actions

Scan the QR code to install the App and get 2 free unlocks

Unlock quizzes for free by uploading documents