The following graph representing the concentration of the reactant versus time refers to _____-order reaction. 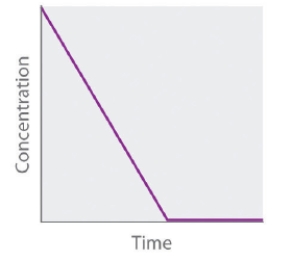
A) first
B) fourth
C) second
D) zeroth
E) third
Correct Answer:
Verified
Q28: For a given number of atoms, isotopes
Q29: The rate of decay is the decrease
Q30: A _ order reaction is one whose
Q31: If a plot of reactant concentration versus
Q32: Which of the following is true of
Q34: The hydrolysis of the anticancer drug cisplatin
Q35: For two or more reactions of the
Q36: The following graph represents the straight-line plot
Q37: The sequence of reactions that occur at
Q38: A linear change in concentration with time
Unlock this Answer For Free Now!
View this answer and more for free by performing one of the following actions

Scan the QR code to install the App and get 2 free unlocks

Unlock quizzes for free by uploading documents