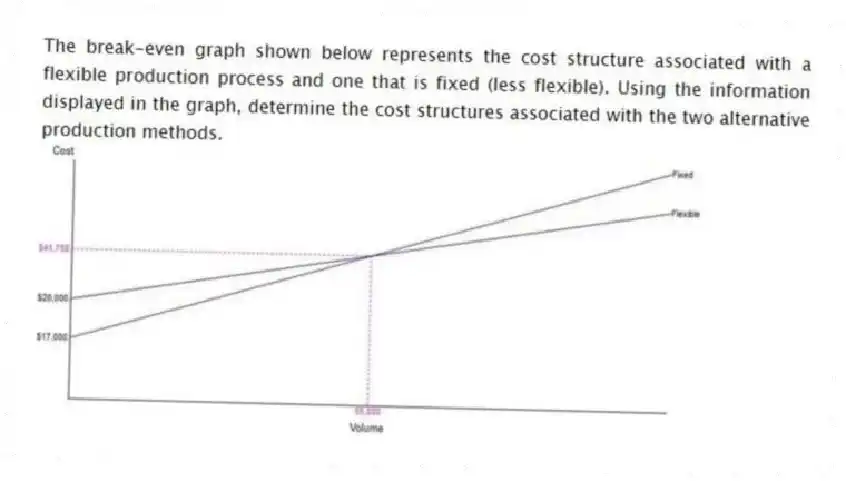
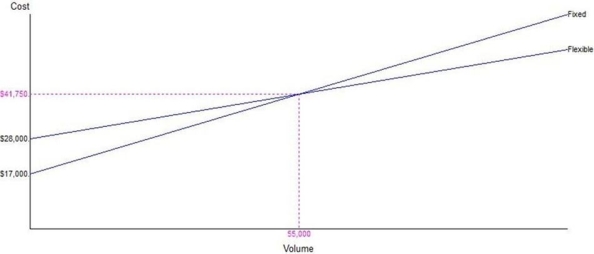
The break-even graph shown below represents the cost structure associated with a flexible production process and one that is fixed (less flexible). Using the information displayed in the graph, determine the cost structures associated with the two alternative production methods.
Correct Answer:
Verified
View Answer
Unlock this answer now
Get Access to more Verified Answers free of charge
Q75: A higher level of fixed automation can
Q76: _ reflects the ways in which customers
Q77: Which statement about economies of scope is
Q78: Which of the following statements concerning resource
Q79: Which of the following statements about additive
Q81: _ are different operations within a facility
Q82: Which one of the following statements concerning
Q83: Front offices generally emphasize top quality and
Q84: A process selected for reengineering should be
Q85: Which of these tools is considered a
Unlock this Answer For Free Now!
View this answer and more for free by performing one of the following actions

Scan the QR code to install the App and get 2 free unlocks

Unlock quizzes for free by uploading documents