Table 5.11
Factors for Calculating Three-Sigma Limits for the
Chart and R-Chart
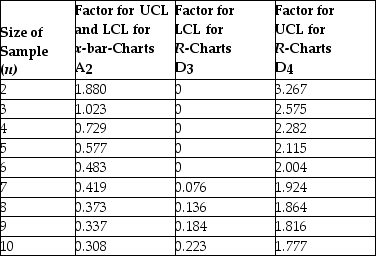
Source: 1950 ASTM Manual on Quality Control of Materials, copyright American Society for Testing Materials. Reprinted with permission.
-Thermostats are subjected to rigorous testing before they are shipped to air conditioning technicians around the world. Results from the last five samples are shown in the table. Create control charts that will fully monitor the process and indicate the result of X-bar and R-chart analysis. 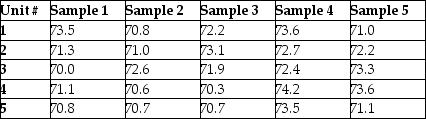
A) x bar and r chart are both out of control
B) x bar chart is in control but r chart is out of control
C) x bar chart is out of control but r chart is in control
D) x bar and r chart are both in control
Correct Answer:
Verified
Q115: Historically, the average time to service
Q116: Table 5.11
Factors for Calculating Three-Sigma Limits
Q117: Which alternative will increase the probability of
Q118: A company is interested in monitoring
Q119: Table 5.11
Factors for Calculating Three-Sigma Limits
Q121: When is it advantageous to use sampling
Q122: The poultry farmer was aghast when the
Q123: Table 5.4
The manager of Champion Cooling Company
Q124: If an x-bar chart is constructed using
Q125: Jerry watched in awe as Warren went
Unlock this Answer For Free Now!
View this answer and more for free by performing one of the following actions

Scan the QR code to install the App and get 2 free unlocks

Unlock quizzes for free by uploading documents