Table 5.11
Factors for Calculating Three-Sigma Limits for the
Chart and R-Chart
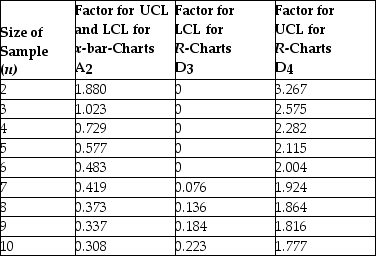
Source: 1950 ASTM Manual on Quality Control of Materials, copyright American Society for Testing Materials. Reprinted with permission.
-Construct 3-sigma X-bar and R-charts using the data in the table. What conclusions can you draw about the state of control for this process? 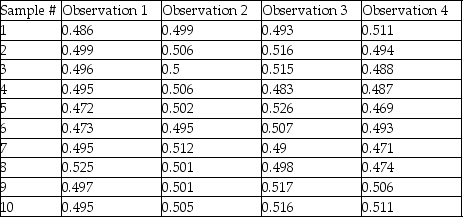
A) X-bar chart is out of control but the R-chart is in control
B) the X-bar chart is out of control and the R-chart is also out of control
C) the X-bar chart and the R-chart are both in control
D) the X-bar chart is in control but the R-chart is out of control
Correct Answer:
Verified
Q111: Historically, the average time to service
Q112: Table 5.11
Factors for Calculating Three-Sigma Limits
Q113: Historically, the average proportion of defective bars
Q114: The defect rate for a product has
Q115: Historically, the average time to service
Q117: Which alternative will increase the probability of
Q118: A company is interested in monitoring
Q119: Table 5.11
Factors for Calculating Three-Sigma Limits
Q120: Table 5.11
Factors for Calculating Three-Sigma Limits
Q121: When is it advantageous to use sampling
Unlock this Answer For Free Now!
View this answer and more for free by performing one of the following actions

Scan the QR code to install the App and get 2 free unlocks

Unlock quizzes for free by uploading documents