
Figure 12.1
This figure represents the impact of supply chain performance on total costs.
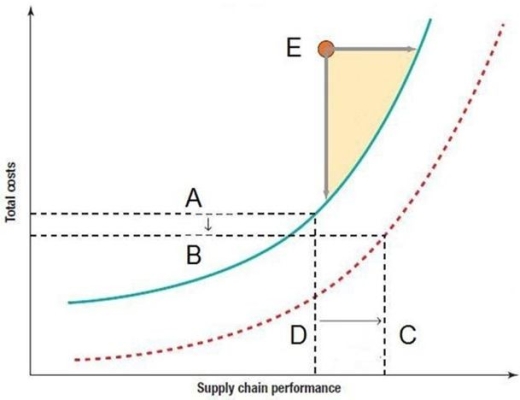
-Refer to Figure 12.1. The movement from point A to point B indicates the:
A) increase in time it takes for your firm to deliver goods and services.
B) decrease in time it takes for your firm to deliver goods and services.
C) increase in cost.
D) decrease in cost.
Correct Answer:
Verified
Q8: The purpose of supply chain management is
Q9: Increasing the percentage of on-time deliveries to
Q10: Compare and contrast efficient versus responsive supply
Q11: The fundamental purpose of supply chain design
Q12: Discuss the major differences between supply chains
Q14: The finished goods of one firm may
Q15: The average inventory at Hamilton Industries, comprising
Q16: Supply chain management tries to match the
Q17: The weeks of supply measure will improve
Q18: The purpose of supply chain design is
Unlock this Answer For Free Now!
View this answer and more for free by performing one of the following actions

Scan the QR code to install the App and get 2 free unlocks

Unlock quizzes for free by uploading documents