
Figure 12.1
This figure represents the impact of supply chain performance on total costs.
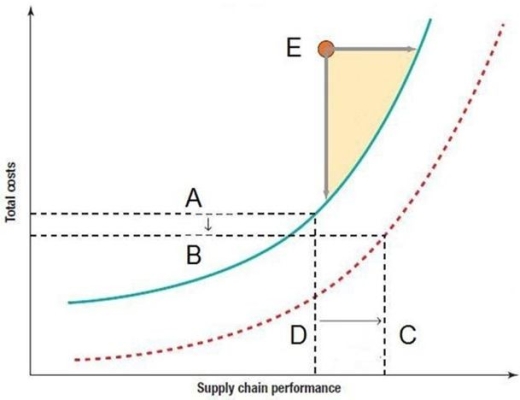
-Refer to Figure 12.1. Which is the best statement if a company simultaneously moves from point A to point B and from point D to point C?
A) The new supply chain efficiency curve is superior to the old one.
B) The new costs are higher, but the performance is better.
C) The new supply chain is still inferior to the supply chain efficiency curve.
D) The new performance is worse, but the costs are lower.
Correct Answer:
Verified
Q1: A typical manufacturer spends:
A) about 25% of
Q3: _ seeks to develop a firm's supply
Q4: Which one of the following is True
Q5: _ is the synchronization of a firm's
Q6: Supply chain design for a service provider
Q7: Selling expenses, fixed expenses and depreciation are
Q8: The purpose of supply chain management is
Q9: Increasing the percentage of on-time deliveries to
Q10: Compare and contrast efficient versus responsive supply
Q11: The fundamental purpose of supply chain design
Unlock this Answer For Free Now!
View this answer and more for free by performing one of the following actions

Scan the QR code to install the App and get 2 free unlocks

Unlock quizzes for free by uploading documents