A study was conduced to determine the effect of extra help sessions attended on students ability to avoid mistakes on a 20- multiple choice test. The data shown below represent the number of extra help sessions attended (x) and the average number of mistakes (y) recorded. 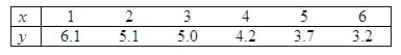 Use the regression formulas to find the least-squares line for the data.
  = ______________
Plot the six points and graph the line.
Does the line appear to provide a good fit to the data points?
______________
Use the least-Squares line to predict the value of y when x = 3.5.
______________
Do the data provide sufficient evidence to indicate that y and x are linearly related at the 1% level of significance?
p-value:
______________
Conclude:
______________
y and x ______________ linearly related.
Calculate the coefficient of determination.
r2 = ______________
What information does this value give about the usefulness of the linear model?
________________________________________________________
Correct Answer:
Verified
Yes; 4.55; .000248; ...
View Answer
Unlock this answer now
Get Access to more Verified Answers free of charge
Q155: The general manager of a chain of
Q156: If the coefficient of determination is 0.975,
Q157: Let x be the weight (in tons)
Q158: The least squares method for determining the
Q159: In a simple linear regression problem, the
Q160: Testing whether the slope of the population
Q161: A medical statistician wanted to examine the
Q162: Evidence supports using a simple linear regression
Q163: A university admissions committee was interested in
Q164: A scientist is studying the relationship between
Unlock this Answer For Free Now!
View this answer and more for free by performing one of the following actions

Scan the QR code to install the App and get 2 free unlocks

Unlock quizzes for free by uploading documents