The following statistics were calculated based on samples drawn from three normal populations: 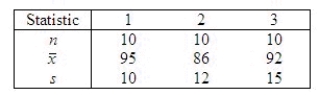 Set up the ANOVA table and test at the 5% level of significance to determine whether differences exist among the population means.
Test statistic = ______________
Critical Value(s) = ______________
Conclusion: ______________
Interpretation:
Differences ______________ exist among the population means.
Correct Answer:
Verified
View Answer
Unlock this answer now
Get Access to more Verified Answers free of charge
Q137: The distribution of the test statistic for
Q138: All members of the F-distribution family are:
A)
Q139: In a one-way ANOVA, which of the
Q140: The analysis of variance is a procedure
Q141: Physicians depend on laboratory test results when
Q143: For which of the following departures from
Q144: An insurance company is considering opening a
Q145: A textile company is interested in knowing
Q146: Water samples were taken at four different
Q147: Consider the following partial ANOVA table:
Unlock this Answer For Free Now!
View this answer and more for free by performing one of the following actions

Scan the QR code to install the App and get 2 free unlocks

Unlock quizzes for free by uploading documents