This bar graph shows the percentage of college freshmen at ABC College needing to take a developmental math class as of the fall of the given year: 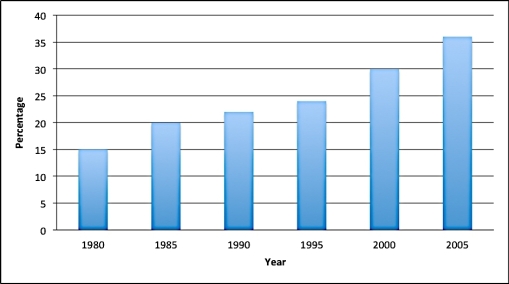 Find the average yearly growth rate from 1995 to 2000.
A) 6.0%
B) 1.6%
C) 1.2%
D) 1.5%
Correct Answer:
Verified
Q32: The following table shows the balance of
Q33: The following table shows the balance of
Q34: In 1949, the inflation rate in the
Q35: A _ is a graph consisting of
Q36: Annual growth rate is calculated as the
Q38: The following table shows the balance of
Q39: This bar graph shows the percentage of
Q40: Suppose the inflation rate of a country
Q41: When in doubt, where should we go
Q42: If you wanted to DE-EMPHASIZE a small
Unlock this Answer For Free Now!
View this answer and more for free by performing one of the following actions

Scan the QR code to install the App and get 2 free unlocks

Unlock quizzes for free by uploading documents