The following table shows the balance of a loan repayment at the end of each month. 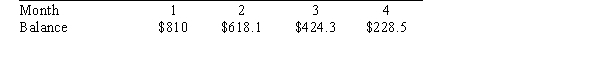 The balance as a function of time is _____ growth with _____ rate.
A) positive; increasing
B) positive; decreasing
C) negative; increasing
D) negative; decreasing
Correct Answer:
Verified
Q28: A smoothed line graph is made from
Q29: The amount of tax you owe is
Q30: A study at ABC College found that
Q31: The following table shows the percentage of
Q32: The following table shows the balance of
Q34: In 1949, the inflation rate in the
Q35: A _ is a graph consisting of
Q36: Annual growth rate is calculated as the
Q37: This bar graph shows the percentage of
Q38: The following table shows the balance of
Unlock this Answer For Free Now!
View this answer and more for free by performing one of the following actions

Scan the QR code to install the App and get 2 free unlocks

Unlock quizzes for free by uploading documents