The following graphic of residential housing data (selling price and size in square feet) indicates ___. 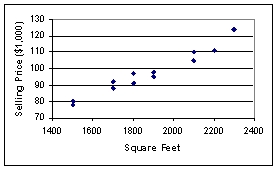
A) an inverse relation between the two variables
B) no relation between the two variables
C) a direct relation between the two variables
D) a negative exponential relation between the two variables
E) a sinusoidal relationship between the two variables
Correct Answer:
Verified
Q74: The staff of Mr.Wayne Wertz, VP of
Q75: According to the following graphic, "Bent Pins"
Q76: The 2019 and 2020 market share data
Q77: The staff of Mr.Wayne Wertz, VP of
Q78: The staff of Mr.Wayne Wertz, VP of
Q80: Each day, the office staff at Oasis
Q81: A shirt production company has tracked their
Q82: Monthly sales were tracked and shown on
Q83: Sales are tracked during the past year
Q84: Two other names for cross tabulations are
Unlock this Answer For Free Now!
View this answer and more for free by performing one of the following actions

Scan the QR code to install the App and get 2 free unlocks

Unlock quizzes for free by uploading documents