Sales are tracked during the past year in the graph below. 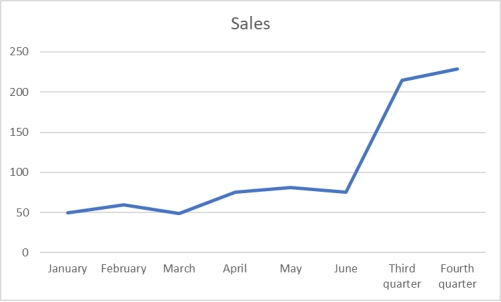 Management is pleased to see the growth in sales at the end of the year.Why would this be an incorrect conclusion?
A) The highest growth was in the month of June
B) Cannot compare sales for different time periods
C) The graph is not showing growth rates
D) A bar graph would be more effective in determining that conclusion
E) A second year of data would be needed to make that conclusion
Correct Answer:
Verified
Q78: The staff of Mr.Wayne Wertz, VP of
Q79: The following graphic of residential housing data
Q80: Each day, the office staff at Oasis
Q81: A shirt production company has tracked their
Q82: Monthly sales were tracked and shown on
Q83: If both variables being analyzed are nominal
Q84: Two other names for cross tabulations are
Q85: A shirt production company has tracked their
Q87: A shirt production company has tracked their
Q102: The following time-series data shows the
Unlock this Answer For Free Now!
View this answer and more for free by performing one of the following actions

Scan the QR code to install the App and get 2 free unlocks

Unlock quizzes for free by uploading documents