A shirt production company has tracked their production since the company started in 1999.The graph of their annual production is shown. 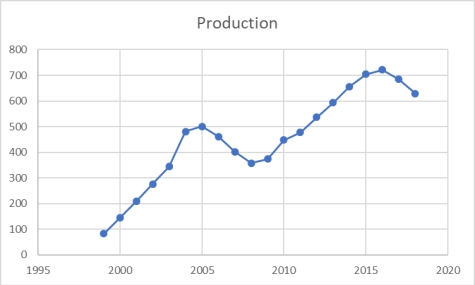 After 2005, in what year did production recover and surpass the production level of 2005?
A) 2006
B) 2009
C) 2010
D) 2012
E) 2013
Correct Answer:
Verified
Q83: If both variables being analyzed are nominal
Q84: Two other names for cross tabulations are
Q85: A shirt production company has tracked their
Q87: A shirt production company has tracked their
Q92: Sales are tracked during the past year
Q93: The following graphic of cigarettes smoked (sold)per
Q99: A retail shoe company would like to
Q102: The following time-series data shows the
Q103: The following time-series data shows the
Q104: To show hourly sales throughout a day,
Unlock this Answer For Free Now!
View this answer and more for free by performing one of the following actions

Scan the QR code to install the App and get 2 free unlocks

Unlock quizzes for free by uploading documents