Figure: The Optimal Quantity
 (Figure: The Optimal Quantity) Look at the figure The Optimal Quantity.If the demand for
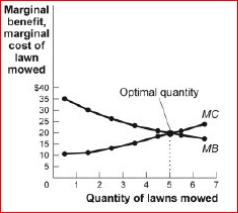
lawn-mowing decreased, the ________ curve in the figure would shift to the and the
optimal quantity would be five lawns mowed.
A.marginal benefit; right; more than
B.marginal cost; right; fewer than
C.marginal benefit; left; fewer than
D.marginal cost; left; more than
Correct Answer:
Verified
View Answer
Unlock this answer now
Get Access to more Verified Answers free of charge
Q43: If the marginal benefit received from a
Q99: The activities of consumers and firms:
A)have benefits
Q105: Use the following to answer questions:
Q105: Q107: Figure: Marginal Benefits and Marginal Costs Q109: Use the following to answer questions: Q111: Figure: The Optimal Quantity Q112: (Table: Marginal Analysis of Sweatshirt Production I) Q114: Figure: Marginal Benefits and Marginal Costs Q115: Figure: The Optimal Quantity Unlock this Answer For Free Now! View this answer and more for free by performing one of the following actions Scan the QR code to install the App and get 2 free unlocks Unlock quizzes for free by uploading documents![]()
![]()
![]()

