Figure: The Optimal Quantity
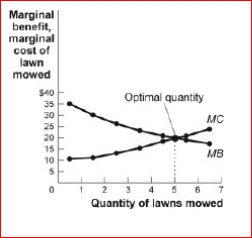
 (Figure: The Optimal Quantity) Look at the figure The Optimal Quantity.If the cost of producing lawn-mowing increased, the ________ curve in the figure would shift to the and the total
net gain would _.
A.marginal benefit; right; increase
B.marginal cost; right; increase
C.marginal benefit; left; decrease
D.marginal cost; left; decrease
Correct Answer:
Verified
View Answer
Unlock this answer now
Get Access to more Verified Answers free of charge
Q43: If the marginal benefit received from a
Q99: The activities of consumers and firms:
A)have benefits
Q105: Use the following to answer questions:
Q107: Figure: Marginal Benefits and Marginal Costs
Q109: Use the following to answer questions:
Q110: Figure: The Optimal Quantity Q112: (Table: Marginal Analysis of Sweatshirt Production I) Q114: Figure: Marginal Benefits and Marginal Costs Q115: Figure: The Optimal Quantity Q116: Unlock this Answer For Free Now! View this answer and more for free by performing one of the following actions Scan the QR code to install the App and get 2 free unlocks Unlock quizzes for free by uploading documents
![]()
![]()
![]()

