Figure: Shifts in Demand and Supply II
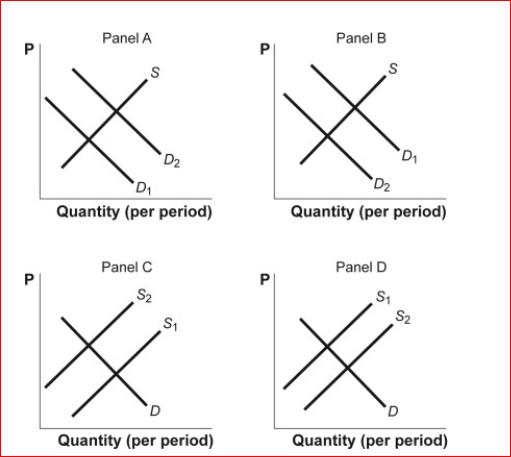
 (Figure: Shifts in Demand and Supply II) Look at the figure Shifts in Demand and Supply II.The figure shows how supply and demand might shift in response to specific events.Suppose the technology for producing ethanol fuel improves.Which panel best describes how this will affect the market for ethanol?
A.panel A
B.panel B
C.panel C
D.panel D
Correct Answer:
Verified
Q183: Figure: Shifts in Demand and Supply IV
Q184: Figure: Shifts in Demand and Supply III
Q185: Figure: Shifts in Demand and Supply IV
Q186: Figure: Shifts in Demand and Supply III
Q187: Figure: Shifts in Demand and Supply IV
Q189: Figure: Shifts in Demand and Supply IV
Q190: If the price of corn is rises,
Q191: Figure: Shifts in Demand and Supply IV
Q193: Figure: Supply and Demand in the Orange
Q207: A decrease in the price of a
Unlock this Answer For Free Now!
View this answer and more for free by performing one of the following actions

Scan the QR code to install the App and get 2 free unlocks

Unlock quizzes for free by uploading documents