Figure: Shifts in Demand and Supply III
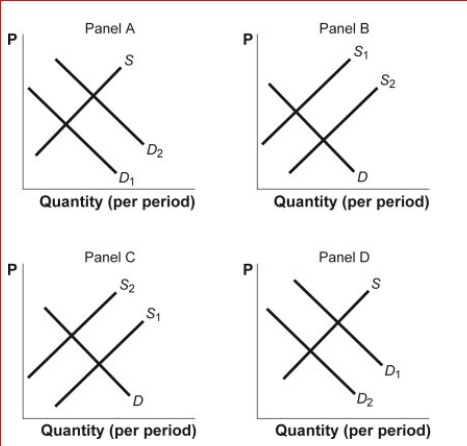
 (Figure: Shifts in Demand and Supply III) Look at the figure Shifts in Demand and Supply III.The figure shows how supply and demand might shift in response to specific events.Suppose a wet and sunny year increases the nation's corn crop by 20%.Which panel best describes how this will affect the market for corn?
A.panel A
B.panel B
C.panel C
D.panel D
Correct Answer:
Verified
Q179: Figure: Four Markets for DVDs
(Figure: Four Markets
Q180: Figure: Shifts in Demand and Supply
Q181: Figure: Shifts in Demand and Supply III
Q182: Assume that corn is an input in
Q183: Figure: Shifts in Demand and Supply IV
Q185: Figure: Shifts in Demand and Supply IV
Q186: Figure: Shifts in Demand and Supply III
Q187: Figure: Shifts in Demand and Supply IV
Q188: Figure: Shifts in Demand and Supply II
Q189: Figure: Shifts in Demand and Supply IV
Unlock this Answer For Free Now!
View this answer and more for free by performing one of the following actions

Scan the QR code to install the App and get 2 free unlocks

Unlock quizzes for free by uploading documents