Figure: Labor Force Participation Rate
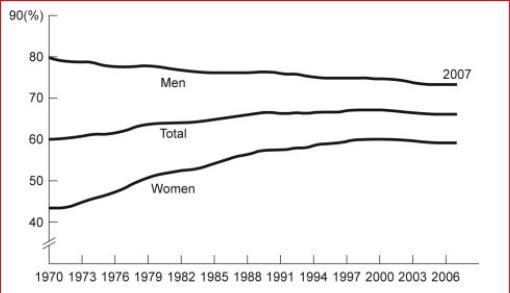
 (Figure: Labor Force Participation Rate) Look at the figure Labor Force Participation Rate.During 1970-1985, the labor force participation rate was _______ for women and for
men.
A.increasing; decreasing
B.increasing; increasing
C.decreasing; increasing
Correct Answer:
Verified
View Answer
Unlock this answer now
Get Access to more Verified Answers free of charge
Q43: Use the following to answer questions :
Q43: Figure: Unemployment Rate over Time

Q44: Figure: Seasonally Adjusted Unemployment Rate
(Figure: Seasonally Adjusted
Q44: Your boss asks you to graph company
Q45: Figure: Seasonally Adjusted Unemployment Rate
(Figure: Seasonally Adjusted
Q46: Figure: Unemployment Rate over Time
(Figure: Unemployment Rate
Q50: Figure: Seasonally Adjusted Unemployment Rate
(Figure: Seasonally Adjusted
Unlock this Answer For Free Now!
View this answer and more for free by performing one of the following actions

Scan the QR code to install the App and get 2 free unlocks

Unlock quizzes for free by uploading documents