Figure: Demand, Revenue, and Cost Curves
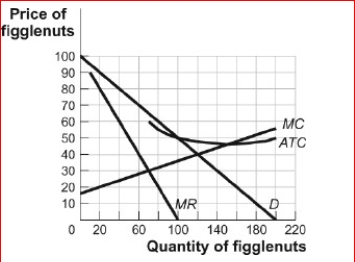
 (Figure: Demand, Revenue, and Cost Curves) Look at the figure Demand, Revenue, and Cost Curves.The figure shows the demand, marginal revenue, marginal cost, and average total cost curves for Figglenuts-R-Us, a monopolist in the figglenut market.Figglenuts-R-Us will sell
________ figglenuts and set a price of to maximize profits.
A.70; $65
B.100; $50
C.120; $40
D.150; $46
Correct Answer:
Verified
Q125: In order to engage in price discrimination
Q128: One government policy for dealing with a
Q129: Figure: Demand, Revenue, and Cost Curves
(Figure: Demand,
Q132: Figure: Total Surplus with a Regulated Natural
Q134: Figure: Demand, Revenue, and Cost Curves
Q135: If the regulation of a monopoly results
Q142: A natural monopoly is one that:
A)monopolizes a
Q152: Price discrimination is the practice of:
A)charging different
Q171: In general, economists are critical of monopoly
Q172: The practice of selling the same product
Unlock this Answer For Free Now!
View this answer and more for free by performing one of the following actions

Scan the QR code to install the App and get 2 free unlocks

Unlock quizzes for free by uploading documents