Figure: Demand, Revenue, and Cost Curves 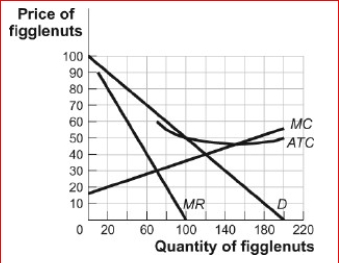
 (Figure: Demand, Revenue, and Cost Curves) Look at the figure Demand, Revenue, and Cost Curves.The figure shows the demand, marginal revenue, marginal cost, and average total cost curves for Figglenuts-R-Us, a monopolist in the figglenut market.If the government wanted to regulate Figglenuts-R-Us such that it would minimize the deadweight loss while allowing the firm to break even, it would impose a price ceiling of in the market.
A) $40
B) $46
C) $50
D) $65
Correct Answer:
Verified
Q129: Figure: Demand, Revenue, and Cost Curves
(Figure: Demand,
Q130: Figure: Demand, Revenue, and Cost Curves
Q132: Figure: Total Surplus with a Regulated Natural
Q135: If the regulation of a monopoly results
Q150: Amtrak is a publicly owned company that
Q157: The practice of charging different prices to
Q165: If a firm wants to charge different
Q171: In general, economists are critical of monopoly
Q171: A monopolist or an imperfectly competitive firm
Q172: The practice of selling the same product
Unlock this Answer For Free Now!
View this answer and more for free by performing one of the following actions

Scan the QR code to install the App and get 2 free unlocks

Unlock quizzes for free by uploading documents