Figure: The Indifference Curve Map II 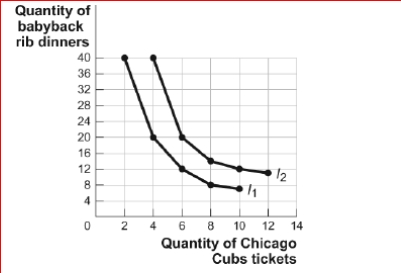
 (Figure: The Indifference Curve Map II) Look at the figure The Indifference Curve Map II.Sara enjoys attending Chicago Cubs' baseball games and eating babyback rib dinners.The figure shows two of her indifference curves for Cubs' tickets and babyback rib dinners.If a new health report is released stating that there is a connection between babyback rib dinners and heart attacks, and this concerns Sara, each combination of Cubs' tickets and babyback ribs will now yield for
Sara.
A) less utility
B) more utility
C) the same level of utility
D) It is impossible to determine how Sara's utility will be affected.
Correct Answer:
Verified
Q56: Sandy has a monthly income of $4,000.She
Q57: As a consumer gives up some of
Q58: Rhonda spends all her income on two
Q59: If the combination of two goods occurs
Q60: An individual consuming two goods, X and
Q62: If the marginal rate of substitution of
Q63: The relative price rule says that at
Q64: Figure: Consumer Equilibrium I The figure shows
Q66: Margo has a monthly income of $60
Q206: Gillian is consuming her optimal consumption bundle
Unlock this Answer For Free Now!
View this answer and more for free by performing one of the following actions

Scan the QR code to install the App and get 2 free unlocks

Unlock quizzes for free by uploading documents