Figure: Consumer Equilibrium I The figure shows three of Owen's indifference curves for pizza and soda per week.Owen has $180 per month to spend on the two goods, and the price of a pizza is $20 and the price of a soda is
$1) 50. 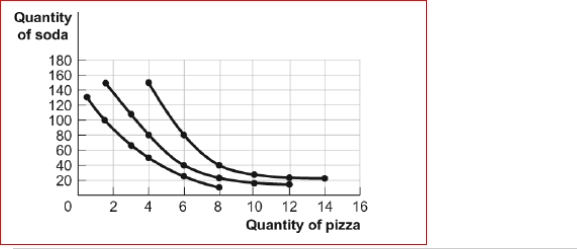 (Figure: Consumer Equilibrium I) Look at the figure Consumer Equilibrium I.If Owen consumes 1.5 pizzas and 100 sodas, which of the following is true?
A) Owen is maximizing his total utility, given his budget line.
B) Owen should consume more pizza and less soda to maximize his total utility, given his budget line.
C) Owen should consume less pizza and more soda to maximize his total utility, given his budget line.
D) Owen should consume more pizza and more soda to maximize his total utility, given his budget line.
Correct Answer:
Verified
Q59: If the combination of two goods occurs
Q60: An individual consuming two goods, X and
Q61: Figure: The Indifference Curve Map II
Q62: If the marginal rate of substitution of
Q63: The relative price rule says that at
Q66: Margo has a monthly income of $60
Q67: Figure: The Indifference Curve Map II
Q69: Joseph chooses a combination of apples and
Q206: Gillian is consuming her optimal consumption bundle
Q215: Joseph chooses a combination of apples and
Unlock this Answer For Free Now!
View this answer and more for free by performing one of the following actions

Scan the QR code to install the App and get 2 free unlocks

Unlock quizzes for free by uploading documents