Figure: Consumer Equilibrium I The figure shows three of Owen's indifference curves for pizza and soda per week.Owen has $180 per month to spend on the two goods, and the price of a pizza is $20 and the price of a soda is
$1) 50. 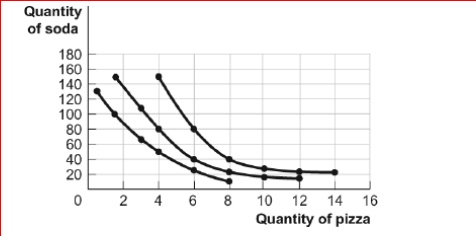
 (Figure: Consumer Equilibrium I) Look at the figure Consumer Equilibrium I.If Owen consumes 1.5 pizzas and 100 sodas, which of the following describes the relationship between his marginal rate of substitution of pizza in place of soda and the relative price of pizza in terms of soda?
A) The marginal rate of substitution equals the relative price.
B) The marginal rate of substitution is greater than the relative price.
C) The marginal rate of substitution is less than the relative price.
D) It is impossible to determine, given the information available.
Correct Answer:
Verified
Q66: Margo has a monthly income of $60
Q67: Figure: The Indifference Curve Map II
Q69: Joseph chooses a combination of apples and
Q71: At the optimal consumption bundle, which of
Q72: Figure: The Indifference Curve Map II
Q73: Figure: Consumer Equilibrium I The figure shows
Q75: Joseph chooses a combination of apples and
Q206: Gillian is consuming her optimal consumption bundle
Q211: Luis is consuming his optimal consumption bundle
Q215: Joseph chooses a combination of apples and
Unlock this Answer For Free Now!
View this answer and more for free by performing one of the following actions

Scan the QR code to install the App and get 2 free unlocks

Unlock quizzes for free by uploading documents